
Sheba - English / Quality metrics / Sheba Care and Service Evaluation Metrics / Quality Metrics 2020 / Quality Metrics 2020 – Q3
Quality Metrics 2020 – Q3
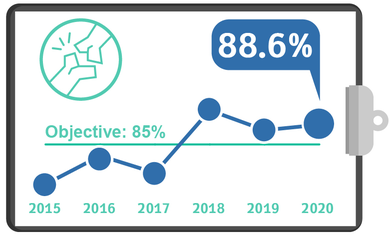
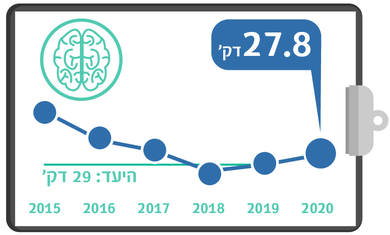
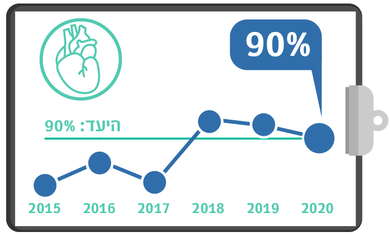
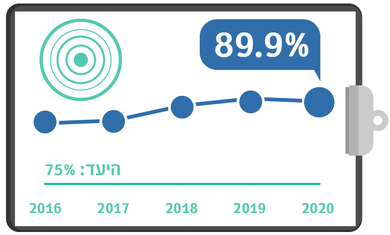
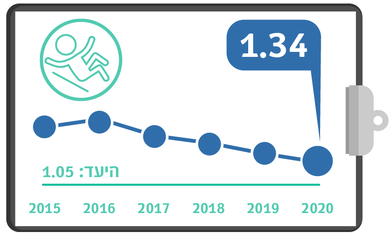
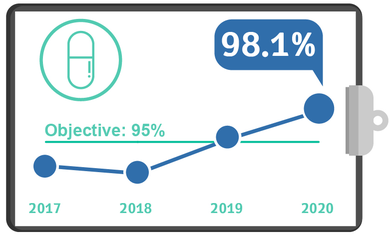
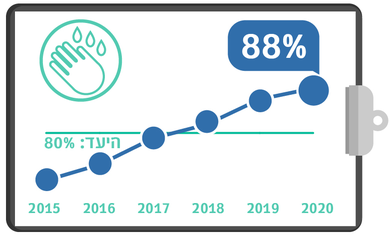
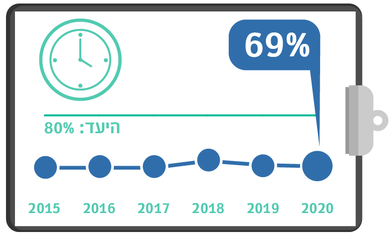
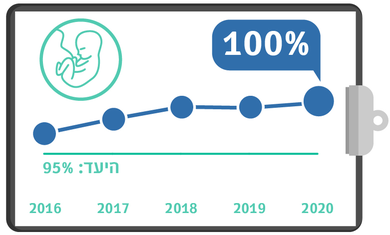
The graphs on this page reflect the weighted data for this year. Press each of the graphs to view the full information on the objectives, measurement methods and results for this quarter.
Updated for Q3 2020: